Where do the photos in Charles W. Cushman’s photo gallery come from?
A brilliant collection of 15,000+ photos featuring images from across the world, but where were the photos taken?
Introduction
For this project I used an expansive collection of photos from the Charles W. Cushman photograph collection. The Cushman collection originates from a thirty-two year span from 1938 to 1969 in which Cushman traveled and took photos across the United States and other countries around the world. During this period of time, Cushman took over 15 thousand pictures to document his travels.
This project seeks to analyze Cushman’s journey and photograph collection by mapping his travels location-by-location. A number of different data visualization tools were used to give an analysis of the wide variety of locations explored through Cushman’s experience.
Sources
All of the actual data from this project came from the aforementioned Charles W. Cushman Photograph Collection, from Indiana University. Each photo was organized to include the photograph’s subject, the date the photo was taken, and other organizational information. The data also included the location of each photograph, organized by country, city, and region. This made it accessible to analyze and arrange by location.
To analyze and arrange the photos’ locations, I used the tool Flourish, an intuitive tool that turns complex data into interactive visuals. Flourish is used to transform any type of raw data into engaging and accessible visualizations.
I also used the tool ArcGIS, to map a collection of the photos on an actual map. Unfortunately, the tool was limited and could not map all 15,000+ photos and only mapped photos taken in a single calendar year.
Processes + Presentation
I downloaded the data associated with Cushman’s photos as a CSV file and edited the data in Google Sheets, removing information that was unnecessary or irrelevant to the collection’s location-based information.
Flourish is a straightforward and easy to access tool, and I simply uploaded the updated CSV file to the website and it provided me a number of recommended forms of data analysis. I chose to use two different types of data visualization charts.
The first, seen below is a “radial” data visualization chart, and was a perfect form of data visualization for the project. The radial chart separated the photos’ locations into different countries, and then split the countries into specific regions and locations. Clearly represented below, the United States takes up the largest percentage of the photos, with the most reocurring state being California. Other countries with many photos include Italy and Canada. The radial chart gave great insight into exactly where the photos from Cushman’s collection came from.
The next type of data visualization I used was a “treemap” chart, and split the locations into different squares of different colors, with each square representing a different location and sub-location. While easy to analyze, it was not as effective as a method of data visualization compared to the radial chart.

Lastly, I used Arc GIS to map Cushman’s travels. As previously mentioned, the software was unable to access all of the data as part of Cushman’s travels, and thus only mapped a limited section of the data. The data provided to Arc GIS was a collection of his photographs taken during 1953, in which he travelled across the United States. The locations of each of the photos taken during 1953 are seen in the map below.
Significance
The visualization provided through this project reveals the work and dedication Cushman put into his travels and photography collection. When scrolling through his collection’s website or his photo’s data it becomes hard to truly appreciate and visualize the travels and time he dedicated to his travels and the project. By using different data visualization tools, it becomes clear to see how much work was put into the project.
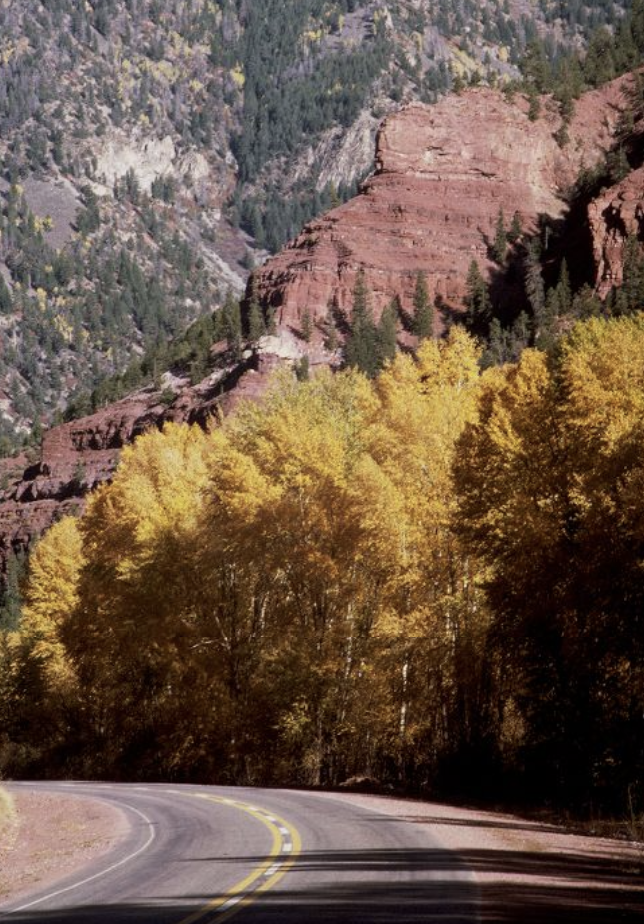
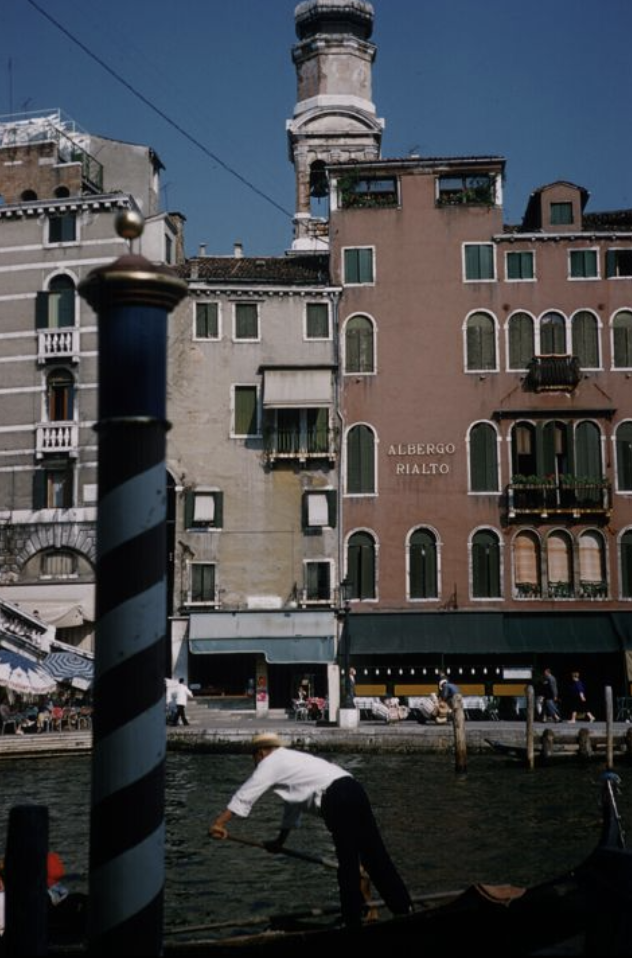
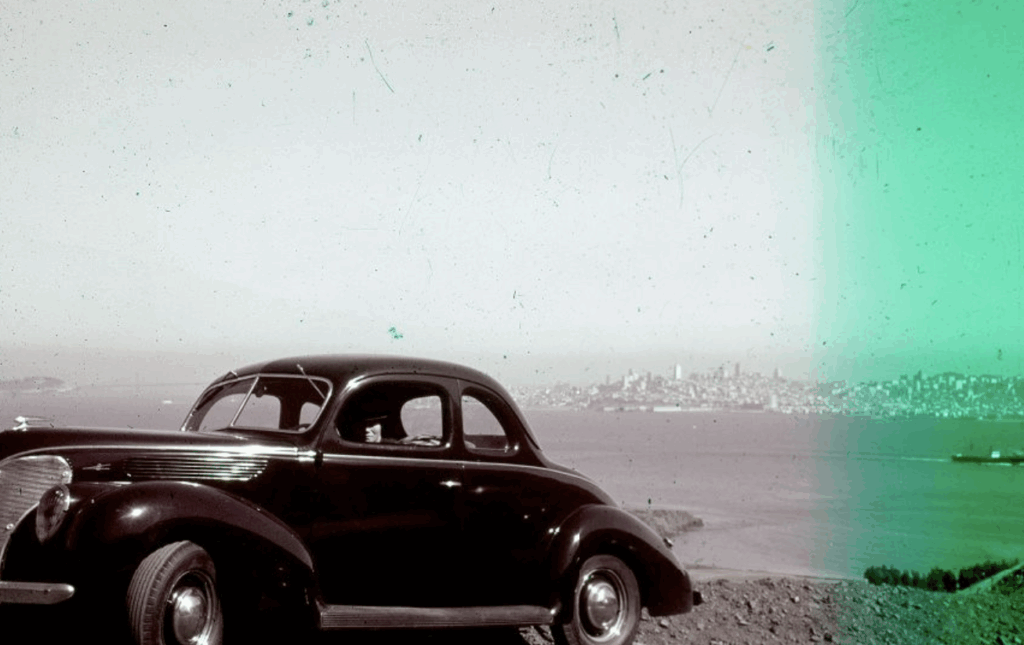
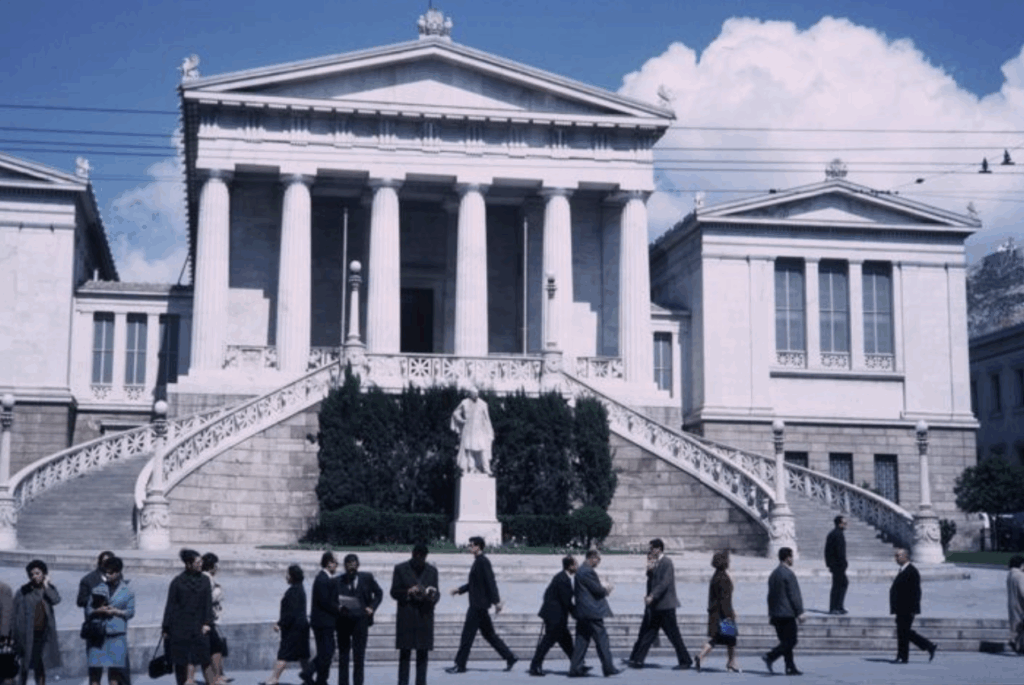
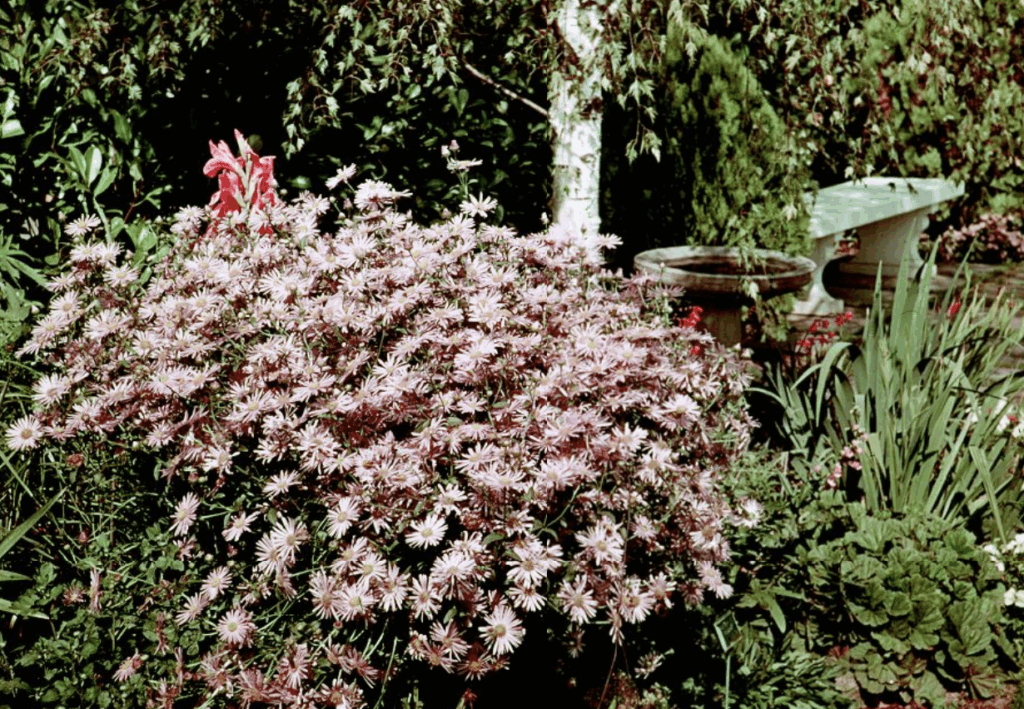
This project tells the story of the travels and efforts done by Cushman and aims to immortalize and share his work. Digital Humanities aims to incorporate different forms of data and technology to share knowledge and information, which is done through this assignment. Some of Cushman’s photos can be seen below.